Logs and Monitoring
OmniSci writes to system logs and to OmniSci-specific logs. System log entries include OmniSci data-loading information, errors related to NVIDIA components, and other issues. For RHEL/CentOS, see /var/log/messages; for Ubuntu, see /var/log/syslog.
Most installation recipes use the systemd installer for OmniSci,
allowing consolidation of system-level logs. You can view the systemd
log entries associated with OmniSci using the following syntax in a terminal
window:
journalctl -u omnisci_server
By default, OmniSci uses rotating logs with a symbolic link referencing the current OmniSci server instance. Logs rotate when the instance restarts. Logs also rotate once they reach 10MB in size. OmniSciDB keeps a maximum of 100 historical log files. These logs are located in the mapd_log directory, which is /var/lib/omnisci/data/mapd_log in a standard installation.
You can configure several of the logging behaviors described above using runtime flags. See Configuration Parameters.
Log Entry Types
omnisci_server.INFO
This is the best source of information for troubleshooting, and the first place you should check for issues. Provides verbose logging of:
- Configuration settings in place when
omnisci_serverstarts. - Queries by user and session ID, with execution time (time for query to run) and total time (execution time plus time spent waiting to execute plus network wait time).
Examples
- Configuration settings in place when
omnisci_server starts:
I1004 14:11:28.799216  1009 MapDServer.cpp:784] OmniSci started with data directory at '/var/lib/omnisci/data'
I1004 14:11:28.801699  1009 MapDServer.cpp:796]  Watchdog is set to 1
I1004 14:11:28.801708  1009 MapDServer.cpp:797]  Dynamic Watchdog is set to 0
- When you use the wrong delimiter, you might see errors like this:
E1004 20:12:00.929049  7496 Importer.cpp:1603] Incorrect Row (expected 21 columns, has 1): [JB141803,02/04/2018
E1004 20:12:19.426657  7494 Importer.cpp:3148] Maximum rows rejected exceeded. Halting load
omnisci_server.WARNING
omnisci_server starts:
I1004 14:11:28.799216 1009 MapDServer.cpp:784] OmniSci started with data directory at '/var/lib/omnisci/data' I1004 14:11:28.801699 1009 MapDServer.cpp:796] Watchdog is set to 1 I1004 14:11:28.801708 1009 MapDServer.cpp:797] Dynamic Watchdog is set to 0
E1004 20:12:00.929049 7496 Importer.cpp:1603] Incorrect Row (expected 21 columns, has 1): [JB141803,02/04/2018 E1004 20:12:19.426657 7494 Importer.cpp:3148] Maximum rows rejected exceeded. Halting load
Reports nonfatal warning messages. For example:
W1229 09:13:50.888172 36427 RenderInterface.cpp:1155] The string "Other" does
not have a valid id in the dictionary-encoded string column "card_class"
(aliased by "color") for table cc_trans.
omnisci_server.ERROR
Logs non-fatal error messages, as well as errors related to data ingestion.
Examples
- When the path in the
omnisqlCOPYcommand references an incorrect file or path.E1001 16:27:55.522930 2009 MapDHandler.cpp:4147] Exception: fopen(/tmp/25882.csv): No such file or directory
- When the table definition does not match the file referenced in the
COPYcommand.E1001 16:30:58.710852 10436 Importer.cpp:1603] Incorrect Row (expected 58 columns, has 57): [MOBILE, EVDOA, Access...
omnisci_server.FATAL
Reports `check failed` messages and a line number to identify where the error occurred. For example:
F1022 19:51:40.978567 14889 Execute.cpp:982]
Check failed: cd->columnType.is_string() && cd->columnType.get_compression() == kENCODING_DICT
Live Logging
Browser-based Live Logging
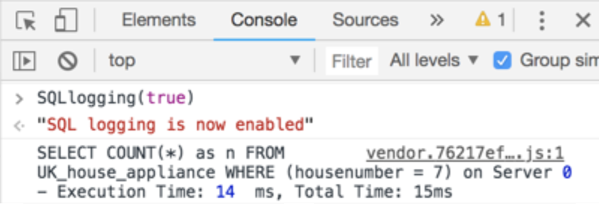
Using Chrome’s Developer Tools, you can interact with data in Immerse to see
SQL and response times from OmniSciDB. The syntax is SQLlogging(true),
entered under the console tab inline, as shown below.

Once SQL Logging is turned on, you can interact with the dashboard, see the SQL generated and monitor the response timing involved.
| Note | When you turn SQL logging on using SQLlogging(true), or turn it off using SQLlogging(false), the change takes effect only after the page has been reloaded or closed and reopened.
|
Command-Line Live Logging
You can “tail” the logs using a terminal window from the logs folder (usually /var/lib/omnisci/data/mapd_log) by the following syntax in a terminal window and specifying the omnisci_server log file you want to view:
tail -f *.INFO
Monitoring
Monitoring options include the following.
From the command line, you can run nvidia-smi to identify:
- That the O/S can communicate with your NVIDIA GPU cards
- NVIDIA SMI and driver version
- GPU Card count, model, and memory usage
- Aggregate memory usage by OmniSci
You can also leverage systemd in non-Docker deployments to verify the status of omnisci_server:
sudo systemctl status omnisci_server
and omnisci_web_server:
sudo systemctl status omnisci_web_server
These commands show whether the service is running (Active: active, (running)) or stopped (Active: failed (result: signal), or Active: inactive (dead)), the directory path, and a configuration summary.
Using omnisql, you can make these additional monitoring queries:
\status
- Returns: server version, start time, and server edition.
- In distributed environments, returns: Name of leaf, leaf version number, leaf start time.
\memory_summary
Returns a hybrid summary of CPU and GPU memory allocation. OmniSci Server CPU Memory Summary shows the maximum amount of memory available, what is in use, allocated and free. OmniSci allocates memory in 2 GB fragments on both CPU and GPU. OmniSci Server GPU Memory Summary shows the same memory summary at the individual card level. Note: OmniSci does not pre-allocate all of the available GPU memory.
A cold start of the system might look like this:
OmniSci Server CPU Memory Summary:
           MAX            USE      ALLOCATED           FREE
  412566.56 MB        8.19 MB     4096.00 MB     4087.81 MB


OmniSci Server GPU Memory Summary:
[GPU]            MAX            USE      ALLOCATED           FREE
 [0]    10169.96 MB        0.00 MB        0.00 MB        0.00 MB
 [1]    10169.96 MB        0.00 MB        0.00 MB        0.00 MB
 [2]    10169.96 MB        0.00 MB        0.00 MB        0.00 MB
 [3]    10169.96 MB        0.00 MB        0.00 MB        0.00 MB
After warming up the data, the memory might look like this:
OmniSci Server CPU Memory Summary:
           MAX            USE              ALLOCATED     FREE
  412566.56 MB     7801.54 MB     8192.00 MB      390.46 MB


OmniSci Server GPU Memory Summary:
[GPU]            MAX            USE      ALLOCATED     FREE
 [0]    10169.96 MB     2356.00 MB     4096.00 MB     1740.00 MB
 [1]    10169.96 MB     2356.00 MB     4096.00 MB     1740.00 MB
 [2]    10169.96 MB     1995.01 MB     2048.00 MB       52.99 MB
 [3]    10169.96 MB     1196.33 MB     2048.00 MB      851.67 MB
